

Rate limits
Most users can expect to use Together AI serverless inference without encountering rate limits. Rate limiting may occasionally occur with high request volumes or large bursts of traffic. Response times can vary depending on the model and current demand.Errors during high demand
When demand is high, Together may limit requests to maintain performance goals:429 Too Many Requests: Reduce your request rate, spread out bursts, and retry with exponential backoff.503 Service Unavailable: Wait briefly, then retry with exponential backoff.
Enterprise and Scale contracts
If you have an active Enterprise or Scale contract, your purchased rate limits stay in place until your contract expires. Nothing changes during your current term.Need guaranteed throughput?
If your workload needs committed throughput and reliability guarantees, provisioned throughput provides reserved capacity with a defined service level agreement (SLA). Contact sales to discuss your requirements.Exceptions
Occasionally, due to the popularity of a specific model, Together may apply custom rate limits or access restrictions. These exceptions are called out in the relevant model documentation.Cost analytics
Together AI provides built-in spend analytics so you can track usage and costs across products and models over time. To control spend with balance cut-offs or keep prepaid workloads funded with auto-recharge, see Spend controls. To access organization-level cost analytics, open your billing settings and scroll to the Usage section. You can also select See detailed cost analytics on the monthly spend card, or open your project’s cost analytics page to scope the view to a single project. Select Current Usage on the billing page to see a draft view of your monthly invoice.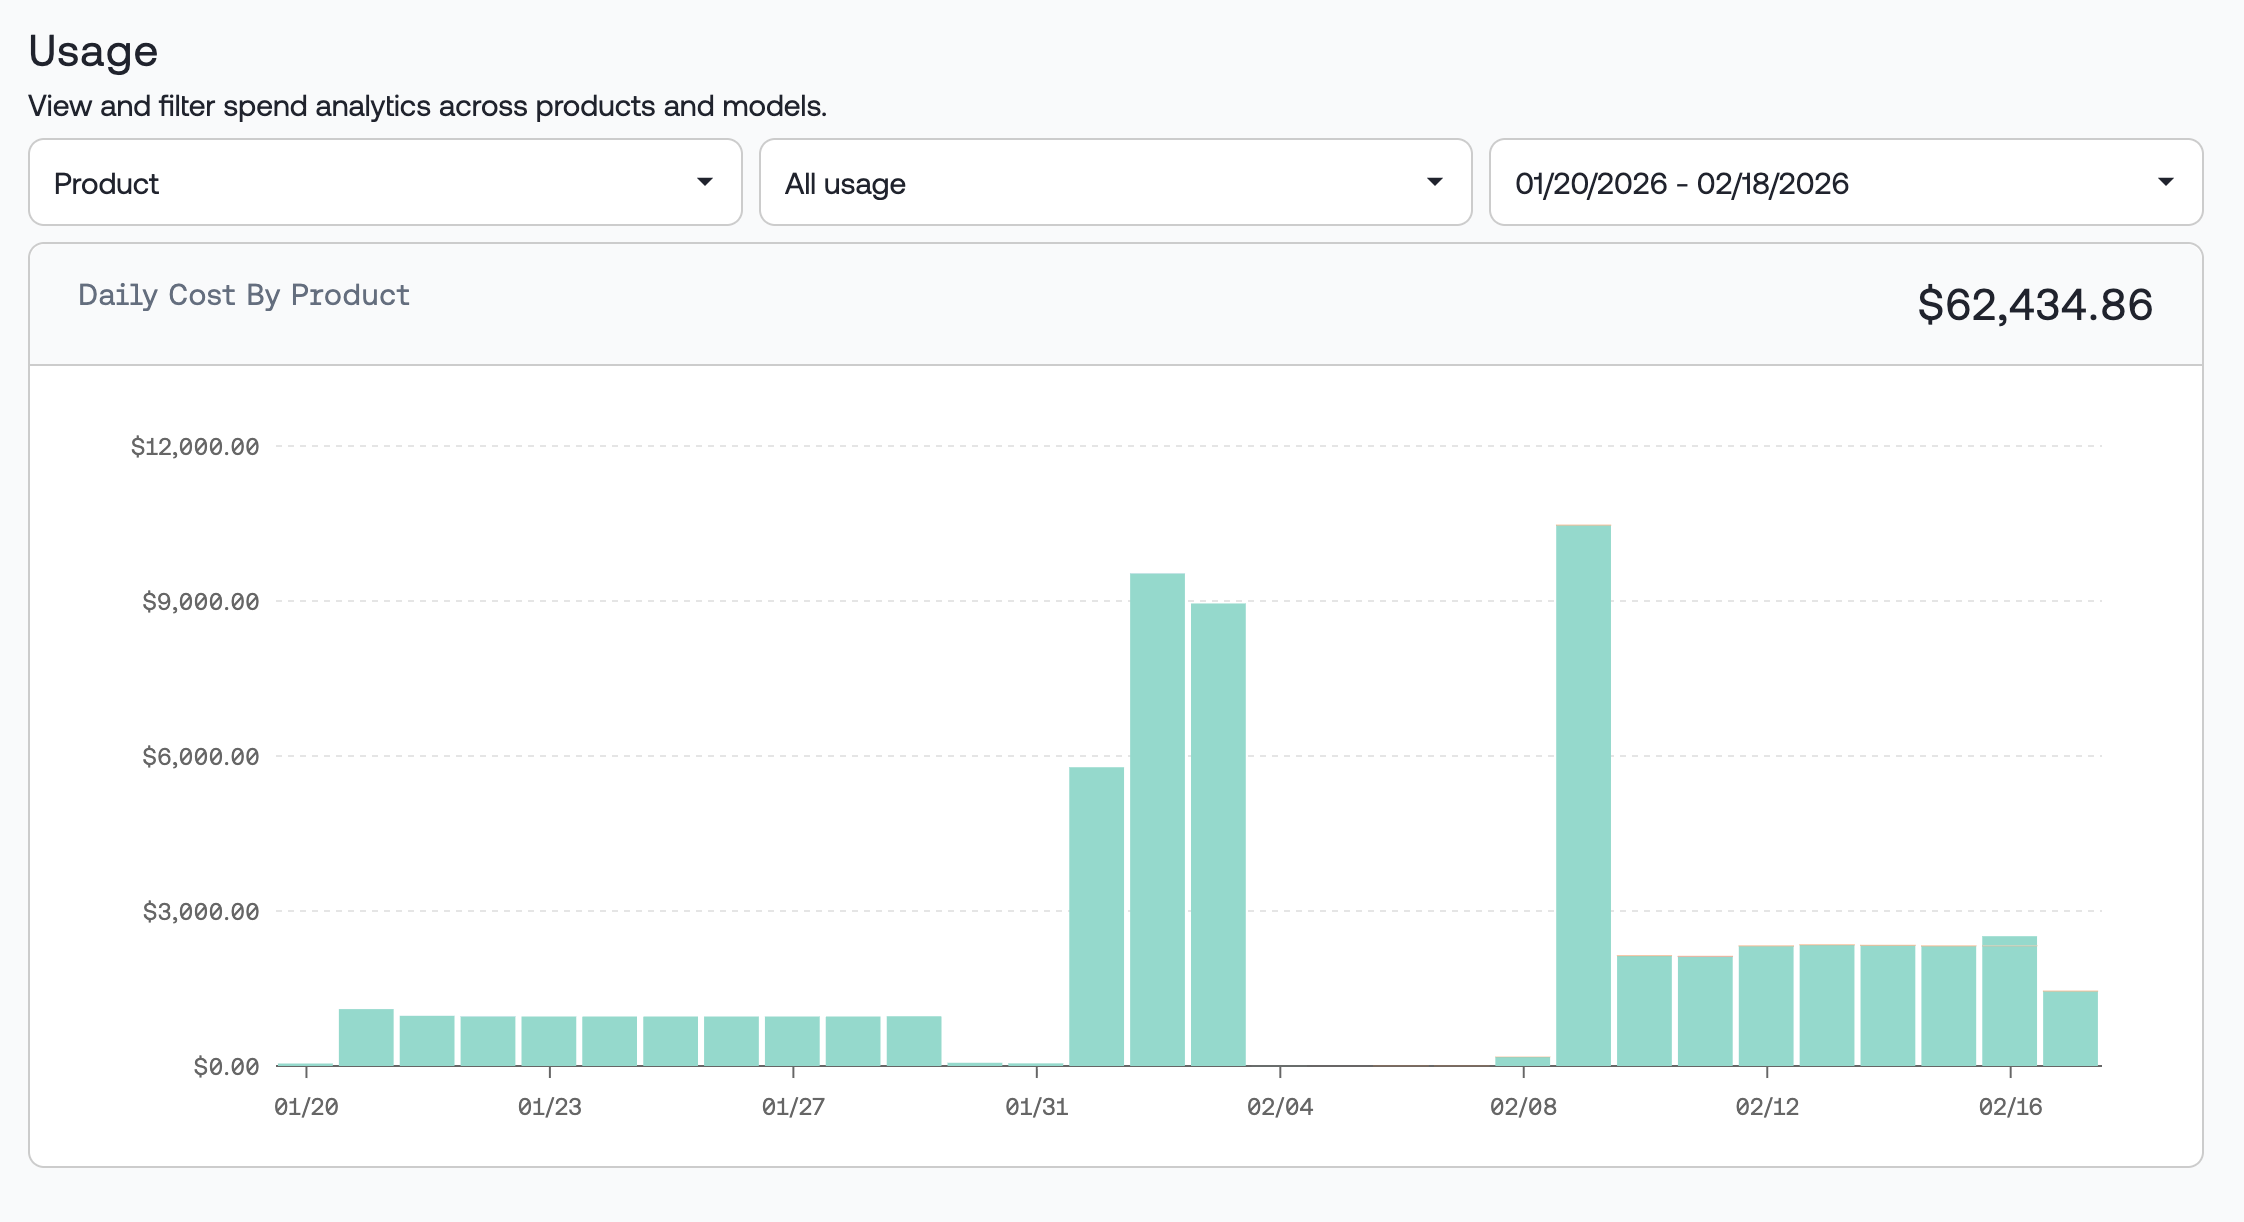
Measure and grouping
The chart toolbar lets you choose how to measure and group usage:- Measure: Cost ($) - Chart daily spend in US dollars for the selected period. This is the default view.
- Measure: Units - Chart daily billable units (for example, tokens) instead of dollar amounts. Totals and tooltips show unit counts. The chart subtitle updates to Daily Units by ….
- Group by Product - Break down by product (Endpoints, Storage, Serverless Inference).
- Group by Line items - Show individual usage line items.
- Group by Project (beta) - Attribute spend or units to projects in your organization.
- Group by API key (beta) - Attribute spend or units to API keys.
Filtering and time range
- Filter - Include or exclude specific series from the current group-by dimension with a multi-select filter (type to search options). The control shows All usage until you apply a filter, and filtering is not available when you group by line items.
- Time range - Adjust the start and end dates to analyze any period of usage history. All dates are in UTC.